11 / 12 · Reports, insights and admin
Answers from your own data, without a spreadsheet.
In detail
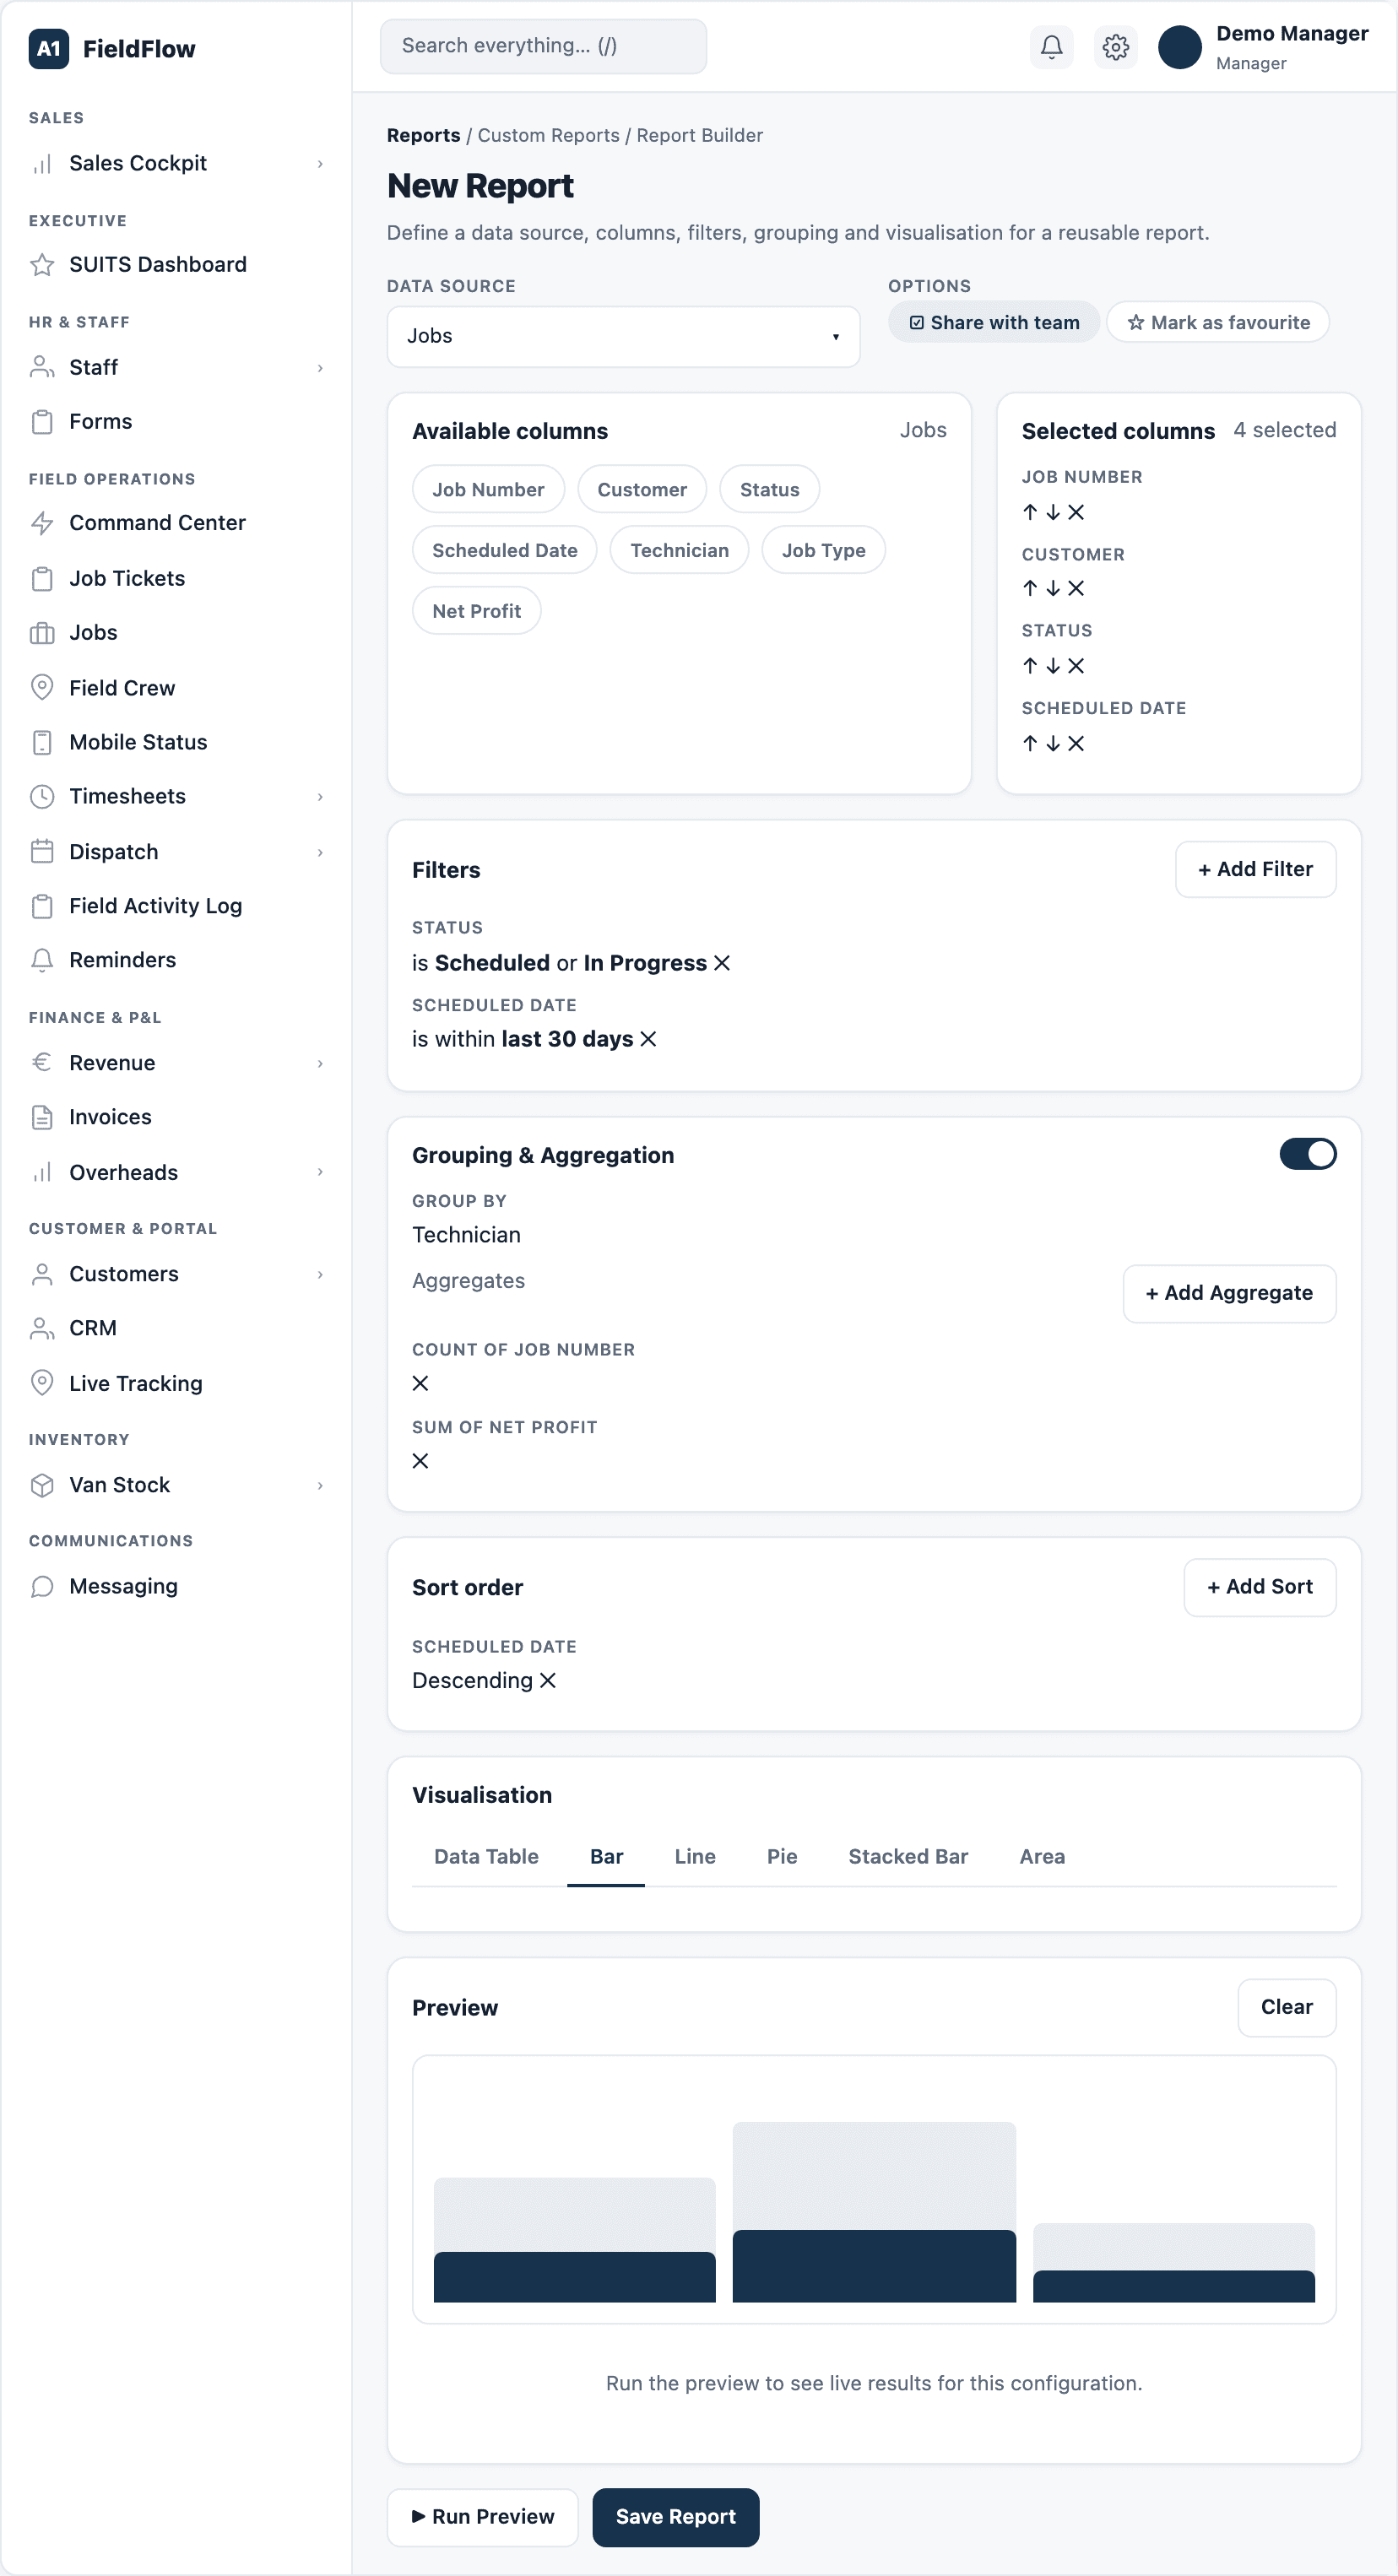
Report builder
- Build reports from 11 sources — jobs, invoices, timecards, materials, customer feedback, leads, customers, staff, expense claims, allocations and holiday requests.
- Filter, group, total, average and sort, then show the result as a table or a bar, line, pie, stacked or area chart.
- Share with the team, favourite or duplicate reports, and export to PDF, Excel or CSV.
Management dashboards
- Money: cash collected this month, money owed by age (0–30, 30–60, 60–90 and 90+ days), and money coming in from due invoices, unbilled work and accepted quotes. Pivot by customer, technician, month or job type, and drill down to any job’s profit and loss.
- People: profit, margin, utilisation, on-time rate, leave, customer rating, wages and overtime for each person, with a 0–100 scorecard.
- Revenue map: where your work comes from, plotted anonymously.
- Activity feed: live revenue, job, timer, safety and data-access events.
Running FieldFlow
- A Setup and Health checklist that shows what is configured, the evidence, and the next step for anything missing.
- A Scheduled Jobs console to see, pause, resume or run background tasks, with schedules in plain English and every change logged.
- Company branding, invoice numbering, email server, message templates and email wording, all set from Settings.
- Printable one-page crew sheets for technicians, office staff, customers and admins.
See your whole operation on one screen.
We walk through dispatch, the technician app and the profit on a job you have already done. Bring one real quote and one real day's schedule.
Book a demo